Click on the image to see a PDF version (for zooming in)
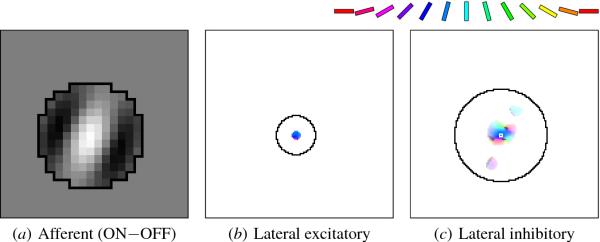
Fig. 5.7. Self-organized V1 afferent and lateral weights. The
weights of the neuron in Figure 5.5 are shown after
self-organization. In (a), the OFF weights were subtracted from the ON
weights, as in Figure 4.6c. This neuron prefers a line oriented at
60o, i.e. diagonal from bottom left to top right, and
responds most strongly to a white line overlapping the light portion
of its RF, surrounded by black areas overlapping the dark
portions. Other neurons developed similar RFs with different preferred
orientations (Figure 5.8). This type of RF structure is commonly seen
in biological V1 neurons (Figure 2.2d; Hubel and Wiesel 1962,
1968). In the lateral weight figures (b, c, and other later such
figures), the following convention is used: The hue (i.e. color)
represents the orientation preference of the source neuron, according
to the key along the top. The saturation of the color (i.e. its
fullness, or intensity) represents how selective the source neuron is
for this orientation; unselective neurons are shown in gray. The value
of the color (i.e. its brightness) indicates the strength of the
connection, with nonexistent or zero-weight connections shown as
white. The jagged black outline traces the original lateral
connections, and a small white square (in c) identifies the neuron
itself. Using such a scale, plot (b) displays the lateral excitatory
weights of this neuron. All connected neurons are strongly colored
blue or purple, i.e. orientations similar to the orientation
preference of this neuron. The lateral inhibitory weights are plotted
in (c). After self-organization and connection pruning, only
connections from neurons with similar orientations remain, and they
are extended along the preferred orientation of this neuron. The
connection pattern is patchy, because connections from neurons with
opposite preferences are weak or have been pruned away entirely. Such
patchy, orientation-specific connection patterns are also seen in
biological V1 neurons (Figure 2.7; Bosking et al. 1997; Sincich and
Blasdel 2001).
|

