Click on the image to see a PDF version (for zooming in)
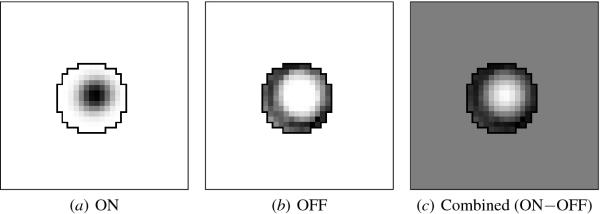
Fig. 4.6. Self-organized V1 afferent weights. The final
afferent weights of the sample neuron at the center of the V1 network
are shown on the (a) ON and (b) OFF sheets as in Figure 4.3a. (c)
Their combined effect is shown by subtracting the OFF weights from the
ON. From initially random weights, a smooth profile emerged on both
LGN sheets, reflecting the Gaussian input patterns. Their combined
effect is center-surround, resulting in a focused, edge-enhanced
response in V1. Because the anatomical RF (shown with the black
outline) of this neuron was positioned slightly left and below its
topographically ordered position, the Gaussian weight patterns formed
slightly above and to the right of the RF center. As shown in Figures
4.7a and 4.8b, these locations represent the retinotopic order well.
|

