Click on the image to see a PDF version (for zooming in)
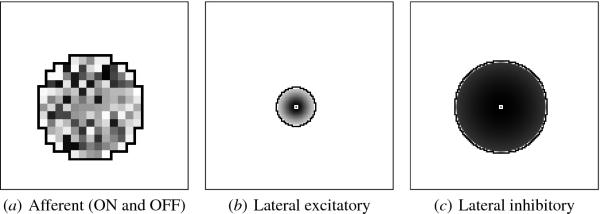
Fig. 5.5. Initial V1 afferent and lateral weights. These plots
show the initial weights of the V1 neuron at location (79,68) in the
142 × 142 V1 map. As in Figure 4.3, each set of weights is outlined in
black and plotted in gray scale on nthe neural region from which they
originate; however, the padding in the LGN is omitted so that the area
of (a) corresponds to that of Figure 5.6b. The neuron itself is marked
with a small white square in (b) and (c). The afferent RFs were
initially random, as shown in (a); the ON and OFF channel weights were
identical for each neuron. Plots (b) and (c) display the lateral
weights of this neuron; initially they had a Gaussian profile. Later
figures will show how these connections become selective and patchy
through self-organization.
|

