Click on the image to see a PDF version (for zooming in)
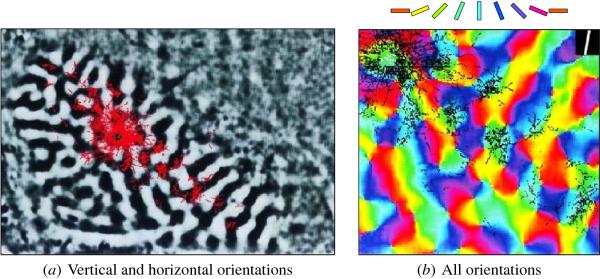
Fig. 2.7. Lateral connections in the tree shrew orientation
map. (a) The vertical and horizontal orientation preferences in a
8 mm × 5 mm section of V1 in the adult tree shrew, measured using
optical imaging. The areas responding to vertical stimuli are plotted
in black and those responding to horizontal stimuli in white. Vertical
in the visual field (90o) corresponds to a diagonal line at
135o in this plot. The small green dot in the middle marks
the site where a patch of vertical-selective neurons were injected
with a tracer chemical. The neurons to which that chemical propagated
through lateral connections are colored red. Short-range lateral
connections target all orientations equally, but long-range
connections go to neurons that have similar orientation preferences
and are extended along the orientation preference of the source
neurons. (b) The same information plotted on a 2.5 mm × 2 mm section
of the full orientation map to the right and below the injection
site. The injected neurons are colored greenish cyan (80o),
and connect to other neurons with similar preferences. Measurements in
monkeys show similar patchiness, but in monkey the connections do not
usually extend as far along the orientation axis of the neuron
(Sincich and Blasdel 2001). These results, theoretical analysis, and
computational models suggest that the lateral connections play a
significant role in orientation processing (Bednar and Miikkulainen
2000b; Gilbert 1998; Sirosh 1995). Reprinted with permission from
Bosking et al. (1997), copyright 1997 by the Society for Neuroscience.
|

