Click on the image to see a PDF version (for zooming in)
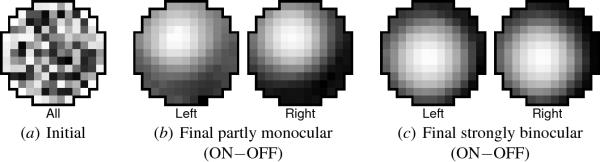
Fig. 5.15. Self-organization of afferent weights into OD receptive
fields. (a) The afferent weights of a sample neuron, located as
shown in Figure 5.17a, are plotted before self-organization (as in
Figure 5.5). Initially these weights are random and identical for both
eyes and both channels in each eye. (b) The final receptive fields of
the same neuron are visualized for each eye by subtracting the OFF
weights from the ON weights (as in Figure 5.7). Over the course of
self-organization, most neurons develop a preference for one eye or
the other, although they retain significant connections from both
eyes. Many of this neuron's connections from the left eye are weak
(indicated by medium gray), so it responds more strongly to input in
the right eye. (c) On the other hand, neurons near the OD stripe
boundaries, like the one in Figure 5.17b, become strongly binocular,
with smooth, isotropic RFs that are nearly identical in each eye. The
ocular dominance stripes shown in Figure 5.16 are based on such subtle
eye preferences, as they are in animal OD maps.
|

