Click on the image to see a PDF version (for zooming in)
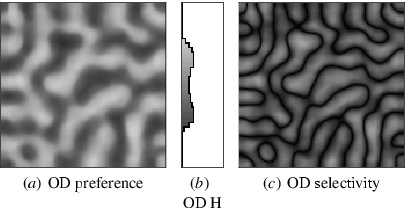
Fig. 5.16. Self-organized ocular dominance map. Light areas in
(a) indicate neurons that prefer the left eye, dark areas those that
prefer the right eye, and medium gray indicates no net preference. The
histogram (b) shows how these preferences are distributed, with left
monocular neurons at the top, binocular neurons in the middle, and
right monocular neurons at the bottom. Most neurons are binocular,
slightly preferring one eye or another, as they do in animals (Figure
2.5). Plot (c) illustrates how selective the neurons are for
ocularity, with light areas indicating monocular neurons and dark
areas those that are binocular. Less selective regions fall between
ocular dominance stripes, as in animal maps.
|

