Click on the image to see a PDF version (for zooming in)
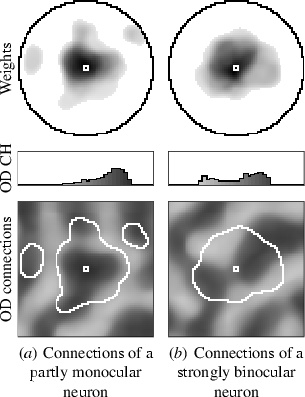
Fig. 5.17. Long-range lateral connections in the ocular dominance
map. The inhibitory lateral connection strengths for the two
neurons in Figure 5.15 are plotted on top in gray scale, and their
local neighborhood is shown in the map below (as in Figure 5.12). In
both cases the strongest connections come from the neuron's near
neighbors. The connections of the partly monocular neuron (a) follow
the ocular dominance map structure, with strongest connections from
neurons with the same eye preference (dark). As a result, the
connection histogram (middle) is biased toward the right eye
(dark). In contrast, the connections of strongly binocular neurons (b)
are not influenced by the OD map, and their connection histograms
mirror the histogram of the OD map (Figure 5.16b). Similar patterns
have been found experimentally in cats (Löwel 1994; Löwel
and Singer 1992).
|

