Click on the image to see a PDF version (for zooming in)
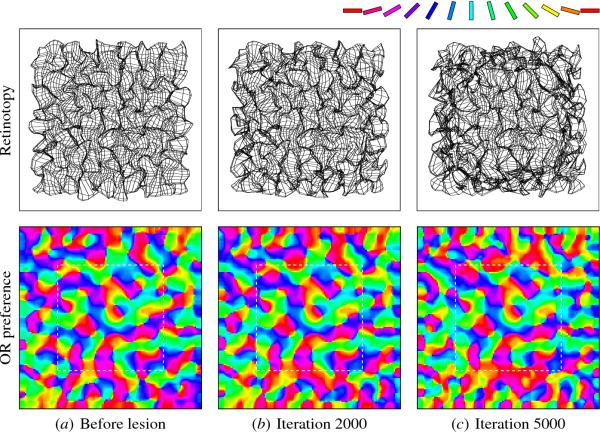
Fig. 6.7. Reorganization of the orientation map after a retinal
scotoma. In the top row, the RF centers of every third neuron in
the network are plotted as a grid in the retinal space; the bottom row
displays the corresponding map of orientation preferences (selectivity
is not shown). The RF centers in the grids are calculated from the
settled response (instead of the afferent weights as e.g. in Figure
5.11; Appendices G.2 and G.3), because the lesioned map is not in
equilibrium with the input. The dotted white line shows the cortical
scotoma, i.e., the region of V1 corresponding to the lesioned area of
the retina. (a) Before the scotoma, the RF centers are organized into
a retinotopic map with orientation-based distortions, as in Figure
5.11. (b) Shortly after the scotoma, neurons whose RFs were entirely
covered by the scotoma retain their old RFs, but the surrounding
neurons start to reorganize their afferent weights into the periphery
of the scotoma. (c) Five thousand iterations after the scotoma, most
of the receptive fields have moved out into the periphery of the
lesion (with corresponding inward changes in perception as
demonstrated in Figure 6.8); how many remain in the center depends on
how large the scotoma is compared with the RFs and the lateral
connections. The orientation map is unchanged within the central
region of the scotoma, but along the cortical scotoma boundary (in
white) many neurons have become selective for the orientation of the
boundary, and the rest of the map has adapted to these changes. The
reorganization of the retinotopic map provides a detailed
computational account for the outward shift in the RF center found by
Chino et al. (1992; Section 6.1.1), while the changes in the
orientation map constitute predictions for future experiments. An
animated demo of the reorganization process can be seen at ...
|

