Click on the image to see a PDF version (for zooming in)
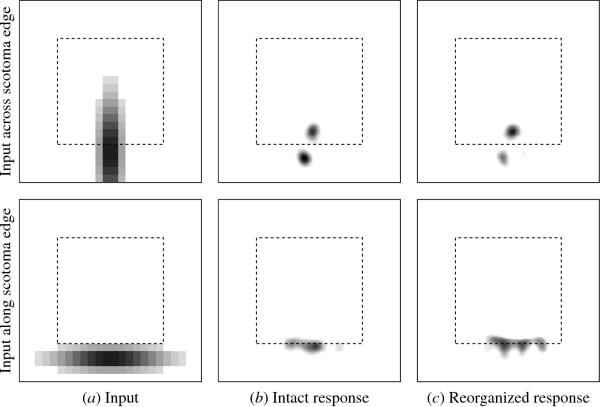
Fig. 6.8. Dynamic RF expansion and perceptual shift after a retinal
scotoma. In the top row, the response of the network to a single
vertical input across the bottom edge of the retinal scotoma (a) is
shown before the lesion (b) and after the cortex reorganized and the
scotoma was removed (c). The lower activity patch, due to neurons just
outside the cortical scotoma, has almost disappeared in the
reorganized response, because these neurons now prefer horizontal
inputs (as seen in the OR map of Figure 6.7c). As a result, these
neurons do not inhibit the neurons inside the scotoma as strongly as
before, and the inside neurons now have larger effective RFs, as
indicated by the slightly larger and more intense top activity
patch. The inward perceptual shift is most clearly seen when the input
is just outside the retinal scotoma and parallel to its boundary, like
the horizontal input below the scotoma in the bottom row. The
reorganized response is much larger than the initial response because
most neurons near the bottom boundary now prefer horizontal inputs. In
addition, the RFs of these neurons have shifted outward (as seen in
the retinotopy plot of Figure 6.7c), which results in a corresponding
small shift of the response pattern inward. These results replicate
the dynamic RF size expansion and the corresponding inward shift in
the perceived location found in biological experiments (Section 6.1.1;
Kapadia et al. 1994; Pettet and Gilbert 1992); the magnification of
boundary orientations is a prediction of the model.
|

