Click on the image to see a PDF version (for zooming in)
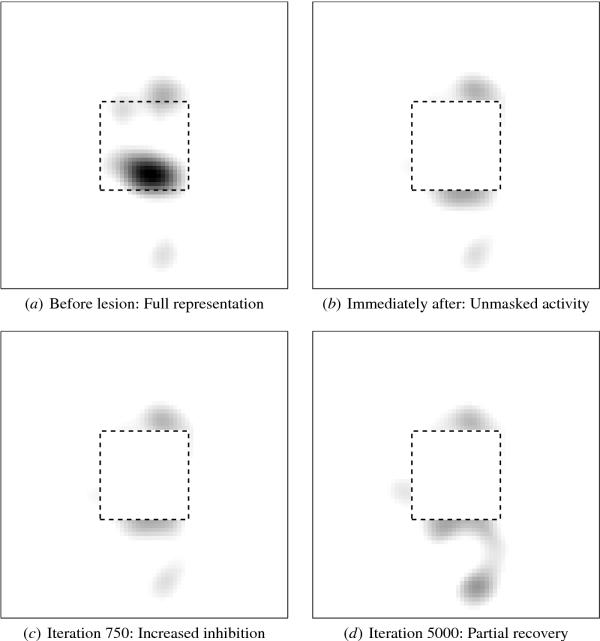
Fig. 6.10. Cortical response after a cortical lesion. The
settled activity of neurons for the central 70 × 70 region of V1 is
shown for the input in Figure 6.9a before the lesion (a), immediately
after (b), several hundred adaptation iterations later (c), and after
complete reorganization, i.e. in the new dynamic equilibrium (d). The
lesioned area is marked as a dotted line in each plot. Immediately
after the lesion, the activity spreads out to neurons that were
previously strongly inhibited by the lesioned neurons. For instance,
most of the activity just below the lesioned area in (b) did not exist
in (a). These neurons partially compensate for the loss of function,
which is less severe than expected. As lateral connections reorganize
(Figure 6.11), this unmasked activity decreases slightly because
lateral inhibition increases: For example, the active area just below
the lesion becomes narrower and lighter (c). In the long term, after
the afferent weights reorganize (Figure 6.12), the activity outside
the lesioned area strengthens again (d). Though lateral inhibition is
still stronger in the perilesion area, the afferent input overcomes
the inhibition, and neurons at the boundary of the lesion become
strongly responsive to inputs previously stimulating lesioned
neurons. Similar stages are seen in biological lesion experiments
(Section 6.1.2; Merzenich et al. 1990).
|

