Click on the image to see a PDF version (for zooming in)
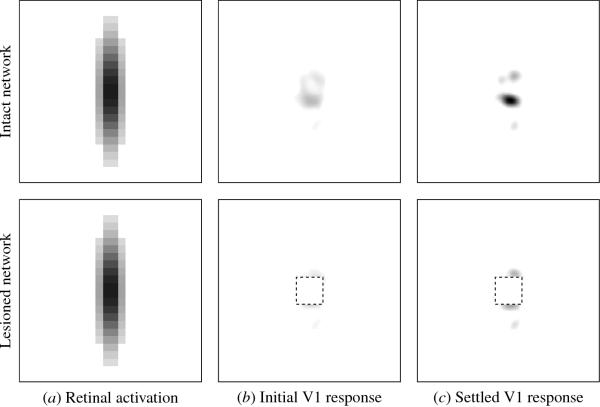
Fig. 6.9. Retinal activation and V1 response before and after a
cortical lesion. The initial and settled responses of the intact
network (top row) and the lesioned network (bottom row) to the retinal
activation in (a) are shown in (b) and (c), as in Figure 6.6. The
cortical lesion is simulated by keeping the input intact but setting
the activity of cortical neurons to zero in a central region of the
map (indicated by the dotted line in b and c). As with a retinal
scotoma, the changes in activity disrupt the dynamic equilibrium and
force the network to reorganize.
|

