Click on the image to see a PDF version (for zooming in)
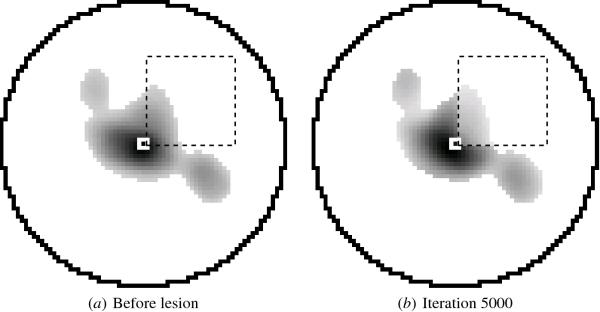
Fig. 6.11. Reorganization of lateral inhibitory weights after a
cortical lesion. The lateral inhibitory weights of a neuron at the
bottom-left corner of the lesion are plotted in gray scale from white
to black (low to high; orientation preferences or selectivity are not
shown). The small white square marks the neuron and the jagged black
outline indicates the connectivity before self-organization and
pruning, as in Figure 5.12. (a) The connections before the lesion
follow the neuron's orientation preference as usual. (b) Through
Hebbian adaptation after the lesion, the connections from neurons in
the lesioned area approach zero, because those neurons are no longer
active. Because the total inhibitory weight is kept constant by weight
normalization, the inhibition concentrates in the connections outside
the lesioned zone. This inhibition decreases the responses of the
perilesion neurons, giving a computational account for the regressive
phase in biology (Section 6.1.2; Merzenich et al. 1990).
|

