Click on the image to see a PDF version (for zooming in)
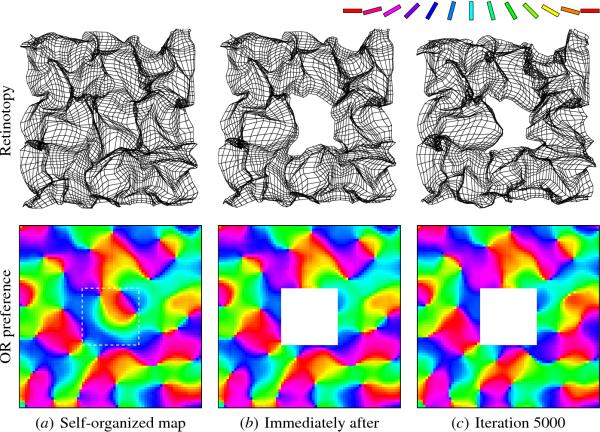
Fig. 6.12. Reorganization of the orientation map after a cortical
lesion. These plots show the retinotopic organization (calculated
from settled responses as in Figure 6.7) and the orientation
preferences of the central 70 × 70 region of the 142 × 142 cortex. The
dotted white line in (a) shows the area that will be
lesioned. Immediately after the lesion, the map spreads out slightly
into the lesioned area, because the neurons near the lesion boundary
respond to inputs previously represented by the lesioned neurons. This
expansion can be observed by comparing corresponding areas around the
lesion in (a) and (b), such as the lesion's top boundary. Over time
(c), the map expands farther into the lesioned area, regaining some of
the lost function. Neurons whose preferred orientations are
perpendicular to the lesion boundary change the most because they have
the most connections cropped by the boundary. For example, along the
top of the lesion, the neurons colored cyan and green on the right
side (with vertical preferences) shift their RFs significantly inward,
whereas the red, orange, and purple neurons on the left side (with
nearly horizontal preferences) do not change much. Thus, the model
gives a possible computational explanation for the observed
reorganization processes in biology (Section 6.1.2; Merzenich et
al. 1990). It further predicts that the specific patterns of expansion
depend on the orientation preferences of the neurons around the
lesion, and that the extent of recovery depends on how large the
lesion is compared with lateral excitation and the afferent receptive
fields. An animated demo of the reorganization process can be seen at
...
|

