Click on the image to see a PDF version (for zooming in)
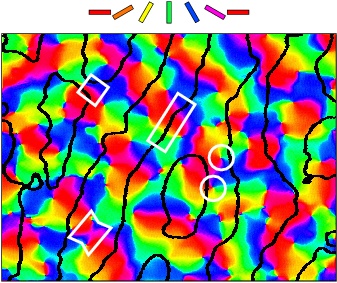
Fig. 5.3. Combined OR/OD map in the macaque. The orientation
and ocular dominance maps shown separately in Figure 2.5 are overlaid
in this plot. Color encodes OR preference (according to the key on
top; example map features are outlined in white as in Figure 2.4), and
the black outlines represent OD stripe boundaries, obtained as areas
of high OD gradient. The features in the two maps are systematically
organized. The OD boundaries intersect the OR boundaries of linear
zones (long rectangle) at right angles, and rarely follow an OR
boundary. Pinwheel centers (circles) are usually found well inside the
OD stripes, and rarely near their boundaries. Note that, unlike the
small patches seen in the cat OD maps (Figure 5.2), the OD patches in
the monkey typically consist of long stripes (as also shown in Figure
2.5b). Reprinted with permission from Blasdel (1992b), copyright 1992
by the Society for Neuroscience; annotations added, OD contours
replotted from data by Blasdel (1992a).
|

