Click on the image to see a PDF version (for zooming in)
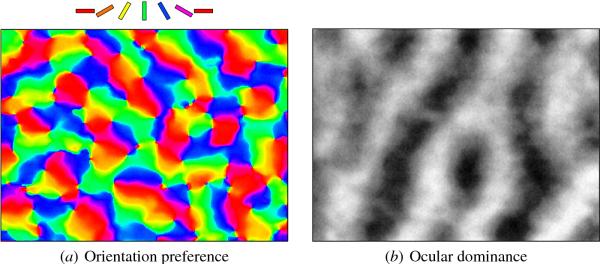
Fig. 2.5. Hierarchical organization of feature preferences in the
macaque. The images illustrate orientation and ocular dominance
patches in a 4 mm × 3 mm area of the cortical surface in the macaque
monkey, measured through optical imaging. (a) The cells are colored
according to their orientation preference as in Figure 2.4a. (b) The
same cells are colored in gray scale from white to black according to
how strongly they prefer input from the left vs. the right eye. Each
neuron is sensitive to a combination of feature values, in this case a
line of a particular orientation in the left or the right eye at a
particular location on the visual field. These maps are shown
superimposed in Figure 5.3, revealing more fine-grained interactions
between the maps. Plot (a) reprinted with permission from Blasdel
(1992b) and plot (b) from Blasdel (1992a), copyright 1992 by the
Society for Neuroscience.
|

