Click on the image to see a PDF version (for zooming in)
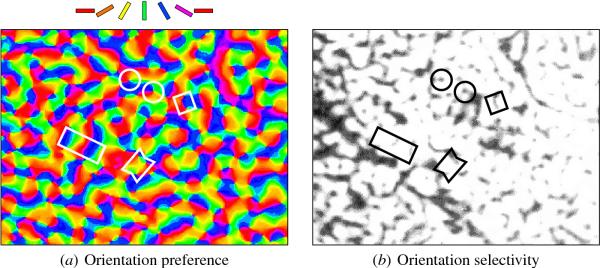
Fig. 2.4. Orientation map in the macaque. (a) Orientation
preference and (b) orientation selectivity maps in a 7.5 mm × 5.5 mm
area of adult macaque monkey V1, measured by optical imaging
techniques. Each neuron in (a) is colored according to the orientation
it prefers, using the color key on top. Nearby neurons in the map
generally prefer similar orientations, forming groups of the same
color called iso-orientation patches. Other qualitative features are
also found. Linear zones are straight lines along which the
orientations change continuously, like a rainbow; a linear zone is
marked with a long white rectangle. Pinwheels are points around which
orientations change continuously. They often occur in matched pairs:
such a pair is circled in white. At saddle points a long patch of one
orientation is nearly bisected by another; one saddle point is marked
with a bowtie. Fractures are sharp transitions from one orientation to
a very different one; a fracture between red and blue (without purple
in between) is marked with a white square. Orientation selectivity
measures how closely the input must match the neuron's preferred
orientation for it to respond. As shown in (b), neurons at pinwheel
centers and fractures tend to be less selective (dark areas) in the
optical imaging response, whereas iso-orientation patches, linear
zones and saddle points tend to be more selective (light
areas). Reprinted with permission from Blasdel (1992b), copyright 1992
by the Society for Neuroscience; annotations added and brightness
increased.
|

