Click on the image to see a PDF version (for zooming in)
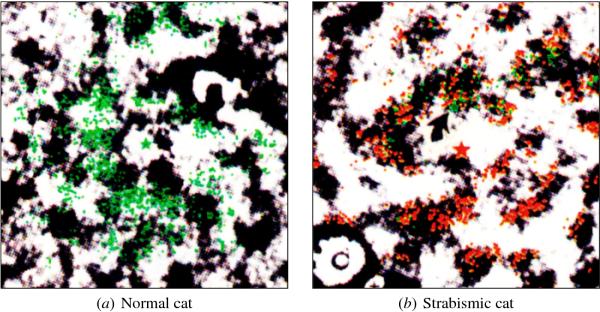
Fig. 5.2. Normal vs. strabismic cat ocular dominance maps and
lateral connections. These plots show corresponding 5 mm × 5 mm
portions of the V1 ocular dominance maps from a normal cat (a) and
from a cat raised with artificial strabismus (b). The maps were
obtained using anatomical tracers, which result in categorical eye
preferences (represented by light and dark areas instead of gray scale
as in Figure 2.5). Both maps contain patches specific to each eye, but
the patches are larger and more sharply delineated in the strabismic
case. In (a), the green star indicates where fluorescent tracer was
injected, and the green dots show where lateral retrograde transport
took them. The lateral connection patterns do not significantly depend
on the ocular dominance patterns. In (b), the red star and the green
star (pointed by the arrow) mark two separate injection sites in
right-eye columns (black). The lateral connections preferentially
target neurons with the same eye preference (black patches, marked
with red and green dots), and avoid neurons with the opposite eye
preference (white). Each injection killed the nearby cells as a side
effect, and therefore the ocular dominance and connection patterns are
not visible in the areas surrounding the injections. Those areas are
likely to be strongly connected to the neurons at the injection
site. Detail of a figure by Löwel and Singer (1992), reprinted
with permission, copyright 1992 by the American Association for the
Advancement of Science.
|

