Click on the image to see a PDF version (for zooming in)
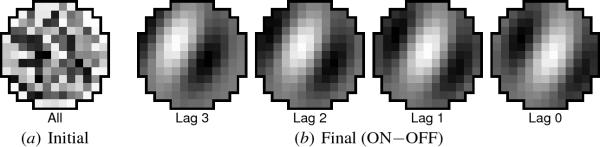
Fig. 5.21. Self-organization of afferent weights into
spatiotemporal RFs. (a) The lag-0 weights for a sample neuron,
located as shown in Figure 5.24a, are plotted before self-organization
(as in Figure 5.5). Initially, all four lags in both channels have the
same random weights; these weights are different for each neuron. (b)
The final afferent weights for the same neuron are visualized by
subtracting the OFF weights from the ON weights (as in Figure
5.7). Together, these plots show that the most effective stimulus for
this neuron is a diagonal light bar moving diagonally down and to the
right. More specifically, this neuron will be highly active at time t
if there was a light bar aligned with the ON subregion in the "Lag 3"
RF at time t-3, a bright bar aligned with the ON subregion of the "Lag
2" RF at time t-2, and so on. Visual cortex neurons in animals have
similar spatiotemporal properties (Figure 5.4a; DeAngelis et
al. 1995).
|

