Click on the image to see a PDF version (for zooming in)
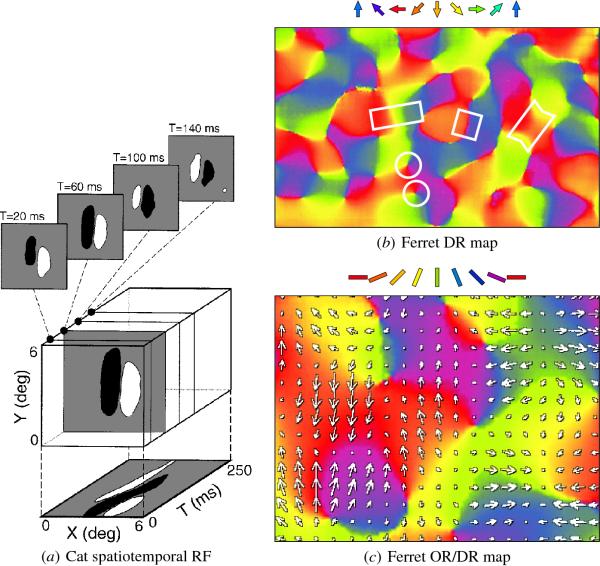
Fig. 5.4. Spatiotemporal receptive fields, direction maps, and
combined OR/DR maps in animals. In addition to orientation and eye
of origin, neurons in V1 are selective for direction of motion. These
spatial and motion preferences can be described as spatiotemporal RFs,
representing the sequence of patterns that would most excite the
neuron. (a) A sample such RF for a V1 cell from the cat, measured
through microelectrode recording (DeAngelis, Ghose, Ohzawa, and
Freeman 1999; reprinted with permission, copyright 1999 by the Society
for Neuroscience; gray scale added). Sample RFs in the two-dimensional
visual space at times 20, 60, 100, and 120 ms are shown on top, and a
continuous integration of the RFs along the vertical (which is the
preferred orientation of the neuron) is drawn in the bottom plane. The
neuron's spatial preferences change systematically over time, giving
it a spatiotemporal preference for a black vertical line moving
horizontally to the right. (b) Spatial arrangement of such preferences
in a 3.2 mm × 1.6 mm area of ferret V1: Nearby neurons prefer similar
directions in a manner similar to orientation maps (measured through
optical imaging and displayed using the color arrow key on top; Weliky
et al. 1996, reprinted with permission, copyright 1996 by Nature
Publishing Group; annotations added and DR arrows removed by
interpolation). Example map features are outlined in white as in
Figure 2.4. (c) Interaction of direction preferences with the
orientation map (Weliky et al. 1996; reprinted with permission,
copyright 1996 by Nature Publishing Group; arrows changed from black
to white). The 1.4 mm × 1.1 mm subarea of V1 around the right edge of
the square in (b) is colored according to orientation preference
(using the color bar key above the plot). Each arrow points in the
preferred direction, and its length indicates how selective the neuron
is for that preference. Direction and orientation preferences tend to
be perpendicular, and orientation patches are often subdivided for
opposite directions of motion.
|

