Click on the image to see a PDF version (for zooming in)
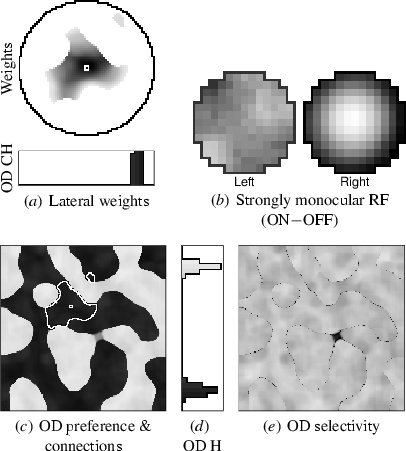
Fig. 5.18. Ocular dominance and long-range lateral connections in
the strabismic ocular dominance map. The strabismic simulation was
otherwise identical to the normal case of Figures 5.15–5.17, except
the inputs were presented at random positions in each eye. Compared
with the normal case, the OD stripes are wider (c), and nearly all
neurons are highly selective (e) and highly monocular (indicated by
the wide separation of the peaks in the histogram d). As an example,
the neuron shown with the small white square in (c) has the receptive
fields shown in (b); the connections from the left eye are poorly
organized and weak (indicated by medium gray). In (c), the white
outline delineates the strongest lateral inhibitory connections to
this neuron. Unlike in the normal case, these connections include only
monocular neurons responding to the same eye (visible in the weight
histogram in (a)), and strictly follow the ocular dominance
stripes. The connections are strongest in the immediate vicinity of
the neuron, but not much weaker even near the stripe boundaries
(a). Overall, strabismus changes the map organization, RFs, and
lateral connections much like it does experimentally in animals
(Löwel 1994; Löwel and Singer 1992; Figure 5.2).
|

