Click on the image to see a PDF version (for zooming in)
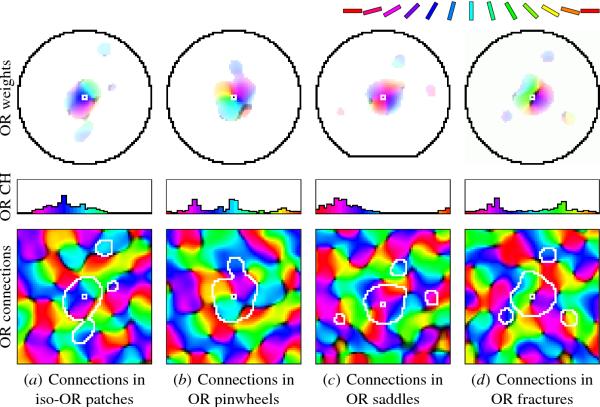
Fig. 5.12. Long-range lateral connections in the orientation
map. The lateral inhibitory connection weights of four sample
neurons from the marked regions in Figure 5.9 are shown in the top
row, situated in the orientation map as shown in the bottom row. The
small white square in both figures identifies the neuron; the black
outline on top indicates the extent of these connections before
self-organization, and the white outline on the map plot shows their
extent after self-organization and pruning. On top, the color coding
represents the connected neuron's orientation, selectivity, and
connection strength, as in Figure 5.7; the map encodes orientation and
selectivity as in Figure 5.9c. The connection histogram (CH) in the
middle shows how many connections come from neurons of each
orientation. For every neuron, the strongest connections originate
from the neuron's nearby neighbors, as indicated by the large, bright
central area in each weight plot. The long-range connection patterns
differ depending on where the neuron is located in the orientation
map. (a) Neurons in the middle of an OR patch receive connections from
neurons with similar preferences, aligned along the orientation
preference of the neuron (for this neuron, about 65o,
i.e. blue). (b) At pinwheel centers, the connections come from all
directions and orientations and are nearly isotropic. The histogram is
nearly flat, with small peaks near orientations that happen to be
overrepresented in the pinwheel. (c) Connections at saddle points
extend along the two orientations of the saddle, in this case red
(0o) and blue (65o). The neuron also makes
connections with intermediate orientations and directions; these
connections match its own OR preference (30o, purple), and
result in one broad peak in the histogram. (The connections of this
neuron are cut off along the bottom because it is located near the
bottom of the map.) (d) Connections of neurons at fractures are also
elongated along the two directions of the neighboring orientation
patches. The neuron plotted in (d) is on a fracture between
yellow-green (130o) and blue-purple (40o), and
makes connections with both of these orientations. In contrast to
saddle points, it does not connect with intermediate orientations and
directions, resulting in two distinct peaks in the orientation
histogram. While the connection patterns in iso-orientation patches
have already been confirmed in biology, the patterns at the other map
features are predictions for future experiments.
|

