Click on the image to see a PDF version (for zooming in)
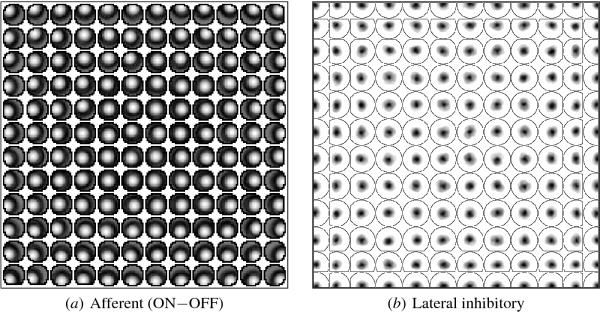
Fig. 4.7. Self-organized afferent and lateral weights across
V1. The selforganized combined afferent weights (as in Figure
4.6c) and the lateral inhibitory weights (as in Figure 4.9b) are shown
for every 12th neuron horizontally and vertically across the V1
network array, starting at neuron (5,5) in the top left corner. (a)
The Gaussian weight pattern systematically moves outward away from the
center of the anatomical RF the closer the neuron is to the edge of
the network, allowing the map to expand to represent the input space
better, as shown in Figure 4.8. (b) Similarly, the lateral inhibitory
weights of units near the edge of the network are elongated along the
edge, allowing sharp responses to form at the edge.
|

