Click on the image to see a PDF version (for zooming in)
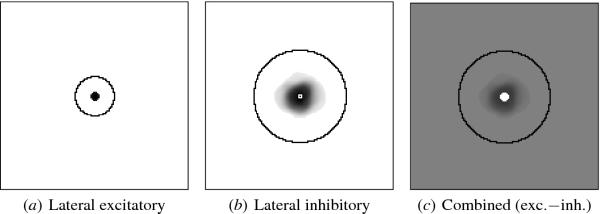
Fig. 4.9. Self-organized V1 lateral weights. The lateral
excitatory (a) and inhibitory (b) weights for the sample neuron at the
center of V1 are plotted on V1 as in Figure 4.3b,c; the small white
square in (b) marks the neuron itself and the jagged black outline
traces the original connectivity before self-organization and
pruning. The combined profile (c) shows inhibitory weights subtracted
from the excitatory, and illustrates the total effect of the lateral
connections: Dark indicates a net inhibitory effect, white a net
excitatory effect, and medium gray no net effect. During
self-organization, smooth patterns of excitatory and inhibitory
weights emerged, resulting in a DoG lateral interaction profile. Near
the edge of the network this profile is elongated along the edge, as
shown in Figure 4.7b. Such profiles sharpen the response of the
network and allow an accurate retinotopic organization to develop.
|

