Click on the image to see a PDF version (for zooming in)
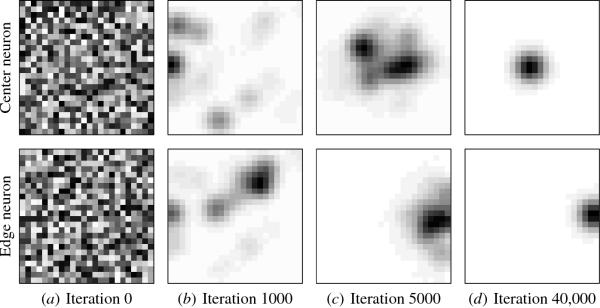
Fig. 3.5. Self-organization of weight vectors. The weight
vectors of two sample units are plotted on the receptor array at
different stages of self-organization. The weight values are
represented in gray-scale coding from white to black (low to
high). Initially (iteration 0) the weights are uniformly randomly
distributed; over several input presentations (such as those shown in
Figure 3.4) the weights begin to resemble the input Gaussians in
different locations of the receptor surface (iterations 1000, 5000,
and 40,000). A neuron at the center of the network (top row) forms a
Gaussian weight pattern at the center, while a neuron at the edge
(bottom row) forms one near the edge. Such weight patterns together
represent the topography of the input space, as seen in Figure 3.6.
|

