Click on the image to see a PDF version (for zooming in)
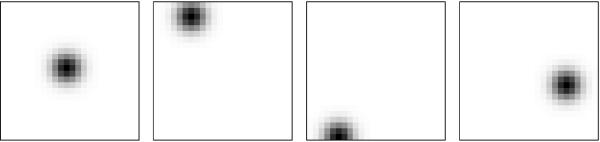
Fig. 3.4. Training a self-organizing map with Gaussian activity
patterns. Each training input is a Gaussian pattern of activation
on the two-dimensional array of 24 × 24 receptors. Four such sample
patterns are shown in this figure, represented in gray-scale coding
from white to black (low to high). The only dimensions of variation
are the x and y positions of the Gaussian centers, and the map
should learn to represent two-dimensional location, or retinotopy, as
a result.
|

