Click on the image to see a PDF version (for zooming in)
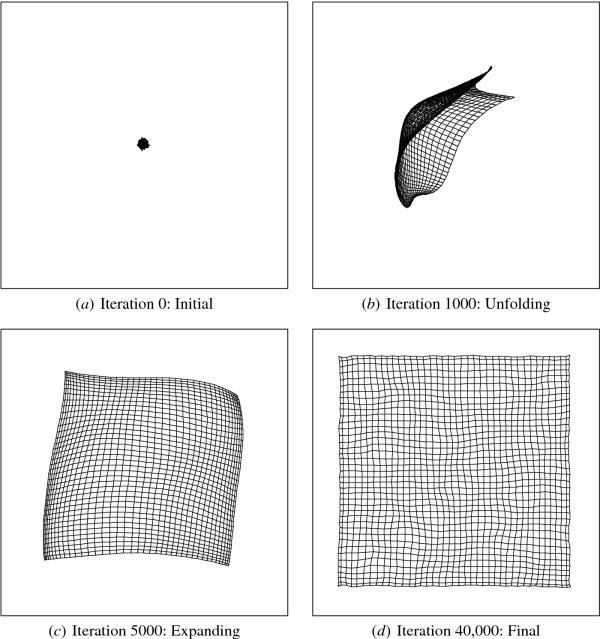
Fig. 3.6. Self-organization of a retinotopic map. For each
neuron in the network, the center of gravity of its weight vector is
plotted as a point on the receptor surface. Each point is connected to
the centers of the four neighboring neurons by a line (note that these
connections only illustrate neighborhood relations between neurons,
not actual physical connections through which activity is
propagated). Initially the weights are random, and the centers are
clustered in the middle of the receptor surface. As self-organization
progresses, the points spread out from the center and organize into a
smooth topographic map of the input space.
|

