Click on the image to see a PDF version (for zooming in)
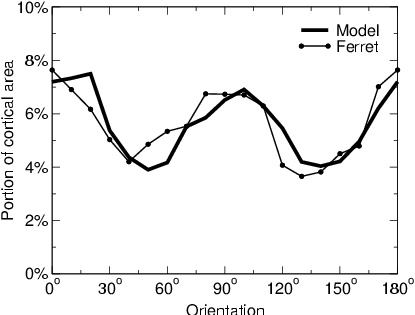
Fig. 9.5. Distribution of orientation preferences in animals and in
HLISSOM. The thin line with circles delineates a histogram of
orientation preferences for a typical adult ferret visual cortex
(replotted from Coppola et al. 1998; measured through optical imaging
in an oval 8.4 mm × 3.3 mm area). The thick line shows a similar
histogram for the "ND+Nature" network from Figures 9.3, 9.4, and
9.6. Both adult ferrets and the HLISSOM model have more neurons
representing horizontal or vertical than oblique contours, reflecting
the statistics of the natural environment. HLISSOM maps trained on
internally generated patterns alone instead have an approximately flat
distribution, as seen in the histograms of Figure 9.1.
|

