Click on the image to see a PDF version (for zooming in)
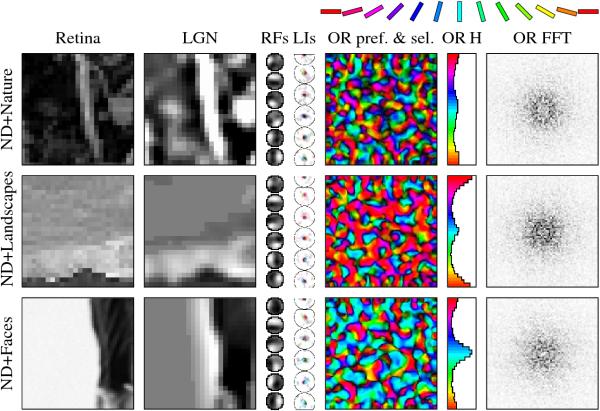
Fig. 9.3. Effect of environmental postnatal training patterns on
orientation maps. Each simulation started with the same initial
map, trained prenatally for 1000 iterations on noisy disks (ND) as
shown in the top row of Figure 9.1. Postnatally, this map was trained
for 9000 iterations under the same parameters but with retina-size
segments of three different kinds of natural image inputs (the full
images for these examples are shown in Figure 8.4d-f). In each case,
maps with realistic features, RFs, lateral connections, and Fourier
transforms developed. The final maps are less selective than those
trained with artificial stimuli (Section 5.3), matching biological
maps well. They also differ significantly on how the preferences are
distributed. The network in the top row was trained on images of
natural objects and primarily closerange natural scenes from Shouval
et al. (1996, 1997). Like biological maps, this map is slightly biased
toward horizontal and vertical orientations (as seen in the
histogram), reflecting the edge statistics of the natural
environment. The network in the second row was trained with stock
photographs from the National Park Service (1995), consisting
primarily of landscapes with abundant horizontal contours. The
resulting map is dominated by neurons with horizontal orientation
preferences (red), with a lesser peak for vertical orientations
(cyan), which is visible in both the map plot and the histogram. The
network in the bottom row was trained with upright human faces, by
Achermann (1995). It has an opposite pattern of preferences, with a
strong peak at vertical and a lesser peak at horizontal (bottom
row). Thus, postnatal self-organization in HLISSOM depends on the
statistics of the input images used, explaining why horizontal and
vertical orientations are more prominent in animal maps, and how this
distribution can be disturbed in abnormal visual environments. It also
suggests that postnatal learning plays an important role in how visual
function develops: It allows the animal to discover what the most
important visual features are and allocate more resources for
representing them.
|

