Click on the image to see a PDF version (for zooming in)
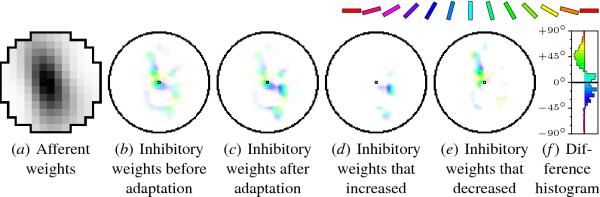
Fig. 7.8. Changes in lateral inhibitory weights due to
adaptation. The strengths of the inhibitory weights to the neuron
marked with a small black square are shown in color coding as in
Figure 5.12. This neuron prefers an orientation of +15o, as
seen from its RF in (a), plotted in gray scale as in Figure
6.4. Before adaptation, the inhibitory connections mostly come from
neurons with similar preferences along this same orientation (b). As a
result of adapting to the vertical input in the center, the blue areas
corresponding to the response to that input become stronger (c). This
effect is summarized in (d), computed by subtracting the weights in
(b) from those in (c), scaling the positive values up to a visible
level, then labeling each connected neuron with the color
corresponding to its orientation preference. Connections increased
only from neurons with vertical preferences, i.e. those that were
active in the settled response (Figure 7.9c,e, top row). As a result
of normalization, the rest of the connections decreased, as seen by
plotting the negative differences in (e). These connections include
all orientations other than vertical. The orientation-specific changes
are summarized in the difference histogram (f), which shows that the
net connection strength to neurons with preferences around vertical
increased, while connections to other orientations decreased. Together
these changes give rise to the direct and indirect TAE, as shown in
Figure 7.9.
|

