Click on the image to see a PDF version (for zooming in)
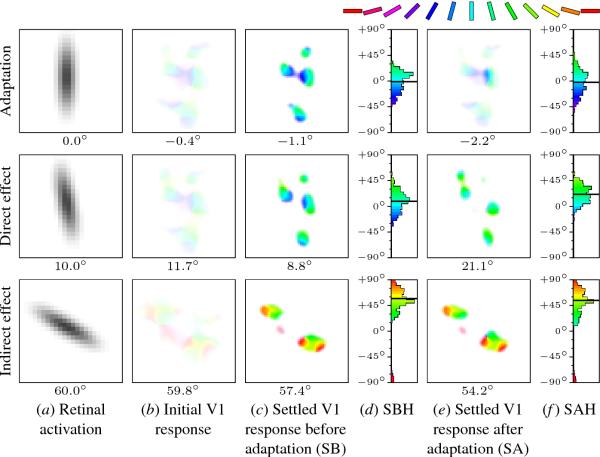
Fig. 7.9. Cortical response during adaptation and during direct and
indirect tilt aftereffect. Using the same plotting conventions as
in Figure 7.4, each row shows (a) an example input, (b) the initial
response of the central 64 × 64 region of V1 to that input (before the
lateral connections), (c) the response of that region settled through
the lateral connections but before adaptation to a vertical input line
(SB), (d) the histogram of SB (SBH), (e) the corresponding settled
response after a very long period of adaptation (SA), and (f) the
histogram of SA (SAH). The top row (labeled "Adaptation") shows these
responses to the same input as used for adaptation. After adaptation,
the settled response is weaker, broader, and includes a wider range of
orientations, but the perceived orientation stays approximately the
same (compare the black lines in each histogram). For an input with a
slightly different orientation (row "Direct effect"), more units
encode orientations greater than 10o (green areas), and
fewer encode those less than 10o (blue areas) in the
settled response after adaptation than before. The net effect is a
direct TAE, with the perceived orientation shifting away from the
adaptation orientation, from 8.8o to 21.1o
(compare the black lines in each histogram). For an input with an
orientation very different from the adaptation pattern, the changes
are more subtle (row "Indirect effect"). Only the neurons around
0o were activated during adaptation. Their inhibition from
other vertical-preferring neurons increased, but decreased from those
not active during adaptation. As a result, the green-colored neurons
nearest 0o are now less inhibited by the rest of the
neurons responding than before adaptation, and so they respond more
strongly. The net effect is an indirect TAE, with the perceived
orientation shifting toward the adaptation orientation, from
57.4o to 54.2o (compare the black lines in each
histogram). Animated demos of these examples can be seen at ...
|

