Click on the image to see a PDF version (for zooming in)
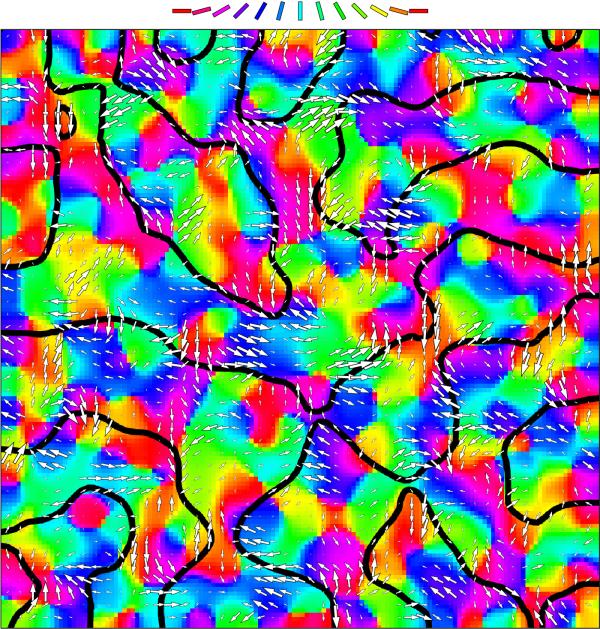
Fig. 5.29. Combined OR/OD/DR map trained with Gaussians. Based
on oriented, moving Gaussian patterns with different brightnesses in
each eye, LISSOM develops overlaid orientation, ocular dominance, and
direction maps simultaneously. This plot shows the orientation
preferences in color coding, the boundaries of the OD stripes in
black, and the direction preferences and selectivities as white
arrows, as in Figures 5.23 and 5.27. The network develops a realistic
orientation and direction map, with OR patches subdivided into areas
preferring the opposite directions of motion. Ocular dominance
boundaries tend to cross linear zones at right angles, rather than
following the orientation map. These results are similar to the ones
with individual input dimensions, complicated by the fact that
multiple dimensions are being mapped at once. Similar results have
been observed experimentally with the cat visual cortex (Hubener et
al. 1997; Löwel et al. 1988).
|

