Click on the image to see a PDF version (for zooming in)
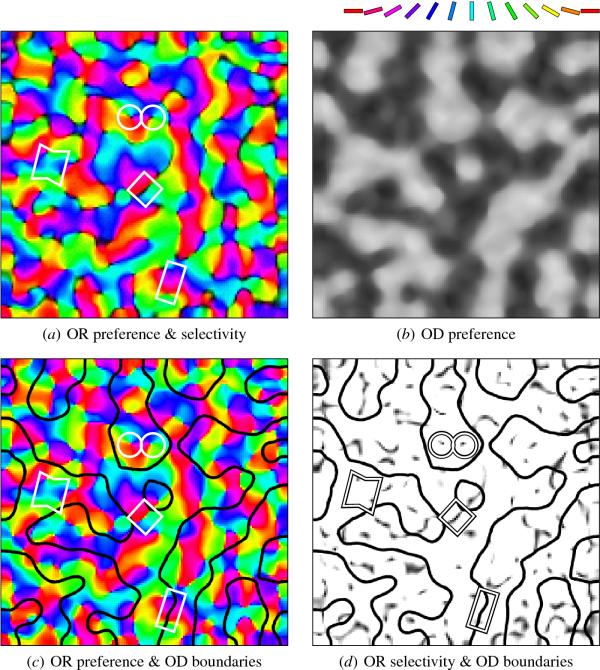
Fig. 5.27. Self-organized OR/OD map. Based on oriented Gaussian
patterns with different brightnesses in each eye, LISSOM develops
realistic orientation (a) and ocular dominance (b) maps in the same
area of cortex. The orientation map features are outlined in (a), (c)
and (d) as in Figure 2.4. In (c), the orientation preferences are
overlaid with the ocular dominance gradient: High gradient (black)
marks the boundary between OD stripes. These boundaries rarely overlap
pinwheel centers or fractures, they intersect OR boundaries in linear
zones at right angles, and they rarely follow OR boundaries. These
relationships are further highlighted in (d), where regions of low
orientation selectivity (pinwheel centers and fractures) are plotted
in dark gray, overlaid with the ocular dominance boundaries. Again,
these features rarely intersect, suggesting that the map organization
results from distributing selectivity for different features evenly
across the cortex. Similar interaction between orientation and ocular
dominance is seen in biological maps (Figure 5.3; Blasdel 1992b).
|

