Click on the image to see a PDF version (for zooming in)
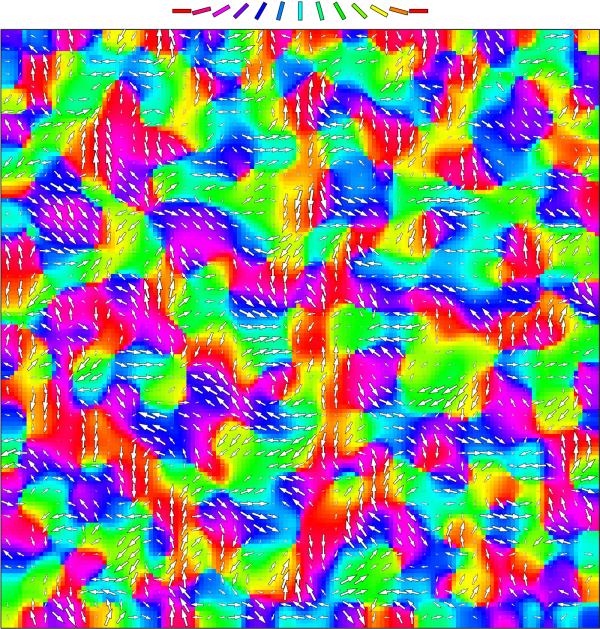
Fig. 5.23. Combined OR/DR map. Using the plotting conventions
from Figure 5.4, each of the 142 × 142 neurons in the LISSOM OR/DR map
is colored with its preferred orientation, and the direction
preferences for every third neuron are plotted as arrows overlaid on
the orientation map. The direction preferences are generally
perpendicular to the preferred orientation, and large iso-orientation
patches are often divided into two areas with opposite direction
preferences. Such an organization matches experimental data well
(Figure 5.4; Weliky et al. 1996). An animated version of this plot can
be seen at ...
|

