Click on the image to see a PDF version (for zooming in)
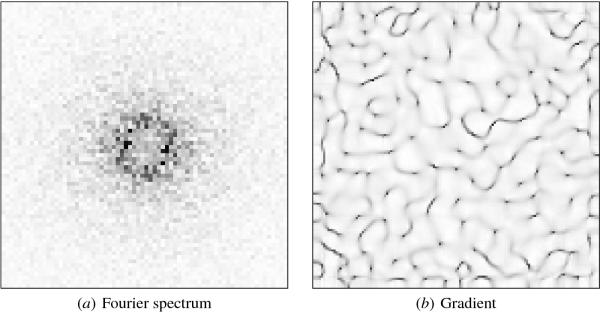
Fig. 5.10. Fourier spectrum and gradient of the orientation
map. (a) The Fourier spectrum is ring shaped as it is for
biological maps (cf. Figure 5.1a), indicating that all directions are
represented at regular intervals. (b) The global arrangement of high-
and low-gradient areas is similar to that in biological maps: Regions
with high gradient coincide with discontinuities such as pinwheel
centers and fractures, and the fractures tend to connect the pinwheel
centers (cf. Figure 5.1b).
|

