Click on the image to see a PDF version (for zooming in)
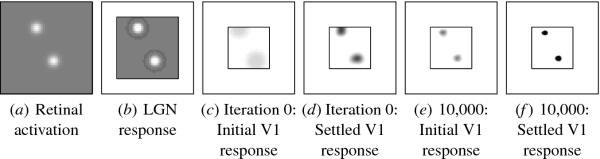
Fig. 4.4. Example input and response. At each self-organization
iteration in LISSOM, the photoreceptors in the retina are activated
according to the gray-scale values of the input image (as described in
Figure 4.1). In this example, two unoriented Gaussians with width
&sigmau = 3.0 were drawn on random spatially separated
locations on a 54 × 54 array of receptors (a). The 36 × 36 ON and OFF
cell responses are plotted in the central square of (b) by subtracting
the OFF cell responses from the ON: Dark areas represent higher
activity in the OFF channel, light areas higher activity in the ON
channel, and medium gray represents equal activation in both
channels. The LGN responds to edges and lines in the input, with high
ON cell activations where the input is brighter than the surround, and
high OFF cell activations where the input is darker than the
surround. Before self-organization (i.e. iteration 0), the 142 × 142
V1 map initially responds broadly and unspecifically to the input
patterns (c); V1 activations are represented in the central square in
gray scale from white to black (low to high). The lateral connections
focus the response into discrete activity "bubbles" in (d), and
connections are then modified. After 10,000 input presentations and
learning steps, the initial and settled V1 responses are more focused,
forming a sparse representation of the input (e and f ). This figure
also illustrates how the retina is mapped to the LGN and the LGN
mapped to V1 in LISSOM. The LGN and V1 networks are drawn to the same
scale as the retina (as indicated by the outside squares), so that
activity at a given location in the LGN and V1 corresponds to a
stimulus at the corresponding location in the retina. The retina is
larger than the LGN and the LGN larger than V1 so that all LGN and V1
neurons have complete receptive fields (i.e. they are not cut off by
the network boundary; Figure A.1). In subsequent activity figures,
such padding is omitted and only the retinal and LGN area that matches
the V1 network is shown. An animated demo of the map response can be
seen at ...
|

