Click on the image to see a PDF version (for zooming in)
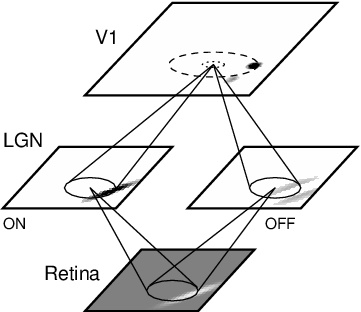
Fig. 4.1. Architecture of the basic LISSOM model. LISSOM
consists of a hierarchy of two-dimensional sheets of neural units,
including an array of retinal receptors, ON and OFF channels in the
LGN, and a cortical network representing V1. The LGN and V1 activation
is shown in gray-scale coding from white to black (low to high). The
activity on the retina (a single oriented Gaussian) is presented like
natural images: Light areas are strongly activated, dark areas are
weakly activated, and medium gray represents background
activation. This input gray scale will be used for all models that
include the LGN and which can therefore process natural images. Sample
connections are shown for one unit in each LGN sheet and one in
V1. The LGN afferents form a local anatomical receptive field on the
retina, and cause ON-center LGN units to respond to light areas
surrounded by dark, and OFF-center units to dark areas surrounded by
light. Neighboring LGN neurons have different but overlapping
RFs. Similarly, V1 neurons have afferent receptive fields on the LGN
sheets. V1 neurons also receive lateral excitatory and lateral
inhibitory connections from nearby V1 neurons; these connections are
shown as dotted and dashed circles around the V1 neuron,
respectively. V1 activity is patchy because only those neurons respond
whose feature preferences match the orientation, eye of origin, and
direction of movement of the pattern currently in their receptive
fields.
|

