Click on the image to see a PDF version (for zooming in)
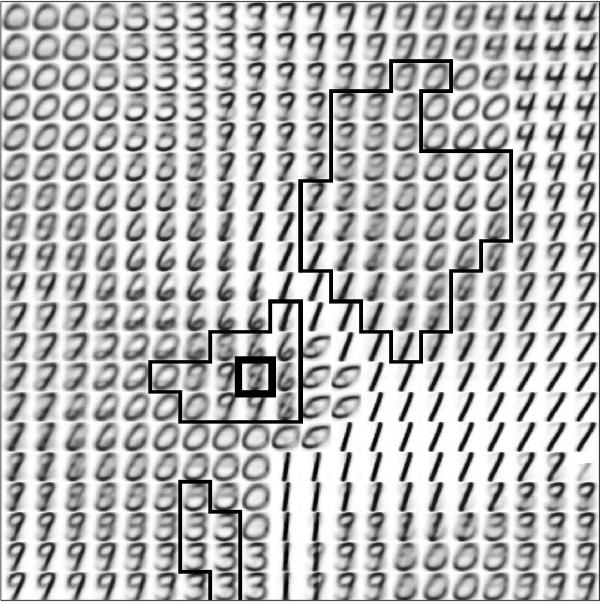
Fig. 14.6. Self-organized LISSOM afferent and lateral weights.
Compared with the SOM map in Figure 14.5, the afferent weights are
less sharply tuned to individual digits and the clusters are more
irregular and change more abruptly, resulting in more distributed
responses (Figure 14.8). The black outline identifies the lateral
inhibitory connection weights with above-average strength of the unit
marked with the thick black square, which is part of the
representation for digit 8. Inhibition goes to areas of similar
functionality (i.e. areas sensitive to similar input), thereby
decorrelating the map activity and forming a sparse representation of
the input.
|

