Click on the image to see a PDF version (for zooming in)
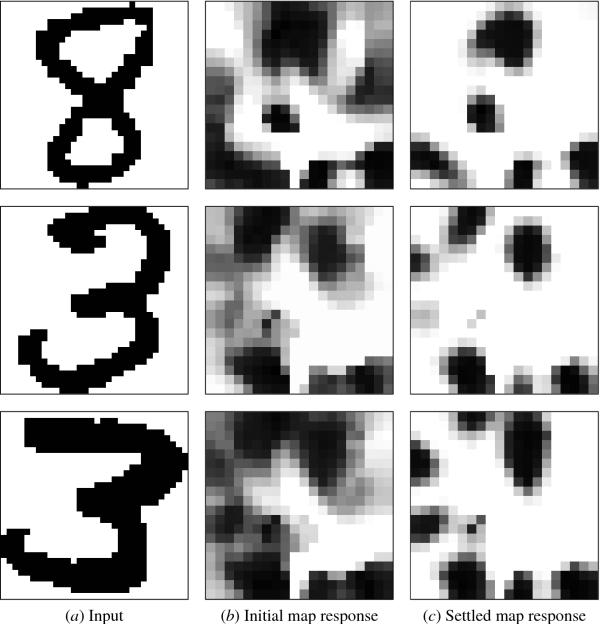
Fig. 14.8. LISSOM activity patterns. As in Figure 14.7, column
(a) shows the normalized input; the LISSOM map activity before and
after lateral interaction is shown in columns (b) and (c). The initial
responses are sparser than in SOM, although the responses for
different digits still overlap significantly. Settling through the
lateral connections removes much of the redundant activation and
focuses the response around the typical active regions for each
digit. After settling, the patterns for the same digit have more
overlap, and those for different digits less overlap than before
settling, making the digits easier to recognize.
|

