Click on the image to see a PDF version (for zooming in)
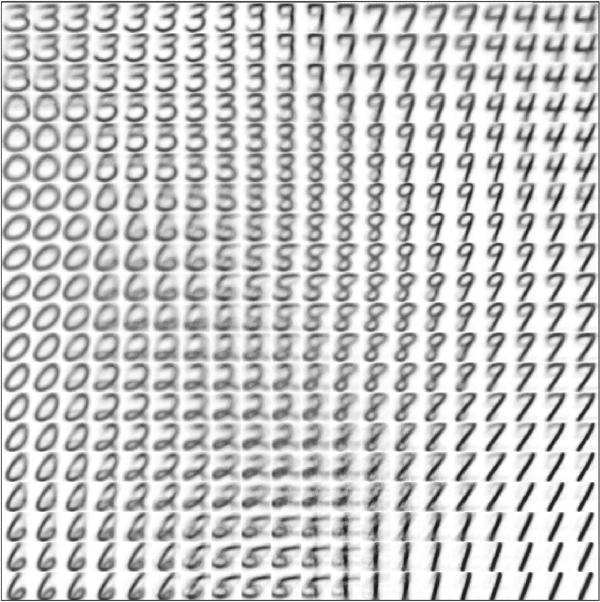
Fig. 14.5. Self-organized SOM afferent weights. The fuzzy
digit-like images display the afferent weights for each unit in the 20
× 20 map, in gray scale from white to black (low to high). The SOM has
a regular global organization with local clusters sensitive to each
digit category. For example, the lower right corner is sensitive to
inputs of digit 1, and this preference gradually changes to 7 and then
to 4 along the right edge of the map.
|

