Click on the image to see a PDF version (for zooming in)
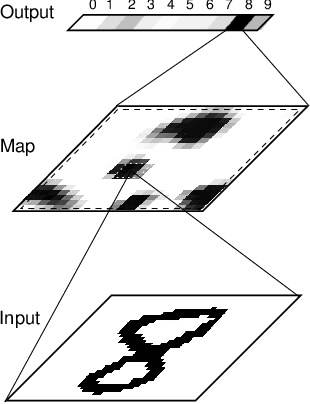
Fig. 14.3. Architecture of the handwritten digit recognition
system. In the input, a normalized bitmap image of digit 8 is
presented. The activation propagates through the afferent connections
to the map, which is either a SOM or a LISSOM network; a LISSOM map is
shown in this figure, together with an outline of the afferent (solid
line), lateral inhibitory (dashed black line), and lateral excitatory
(dotted white line) connections of one neuron. In LISSOM, the activity
settles through the lateral connections into a stable activity pattern
(Figure 14.8); in SOM, the response is due only to the afferent
connections (Figure 14.7). This pattern is the internal representation
of the input that is then recognized by the array of perceptrons at
the output. In this case, the output unit representing 8 is correctly
activated, with weak activations on other units representing similar
digits such as 2, and 9. The gray scale from white to black represents
activity from low to high at all levels.
|

