Click on the image to see a PDF version (for zooming in)
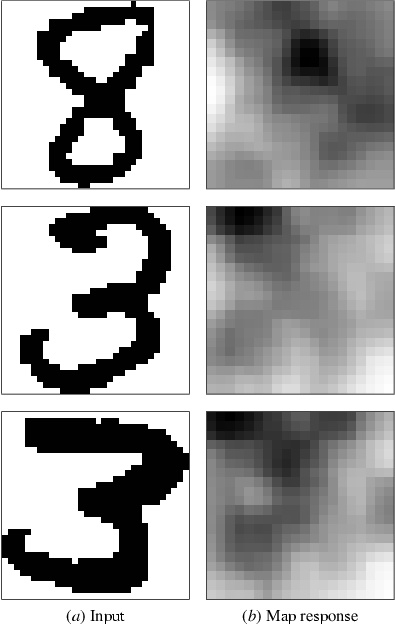
Fig. 14.7. SOM activity patterns. Three samples of normalized
input are shown in (a), and the response of SOM map to each input in
(b). In each case, many units respond with similar activations,
resulting in a broad and undifferentiated activity pattern over the
map. Response patterns for different digits overlap significantly,
making them difficult to classify.
|

