Click on the image to see a PDF version (for zooming in)
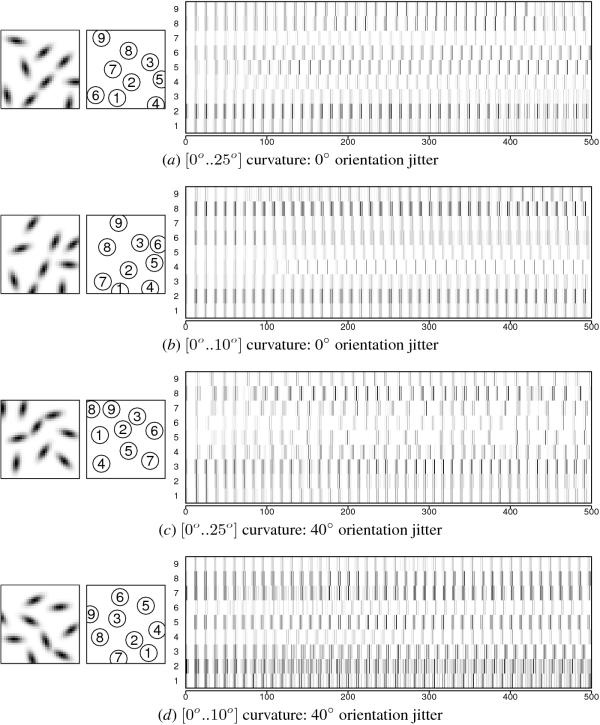
Fig. 13.24. Contour integration process with different curvature
ranges. Both curvature networks show the same degree of synchrony
for the 0o orientation jitter (a vs. b), but in the
40o case, the network trained with a broad range of
curvatures becomes significantly more synchronized than the one
trained with a narrow range (c vs. d). These observations and those
from Figure 13.23 are confirmed quantitatively in Figure 13.25.
|

