Click on the image to see a PDF version (for zooming in)
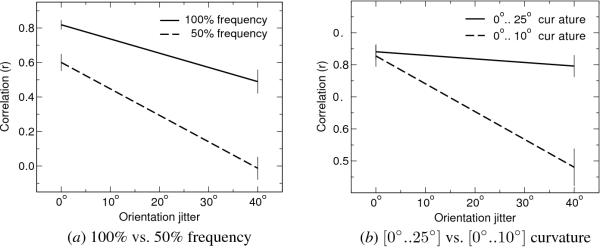
Fig. 13.25. Contour integration performance with different input
distributions. The average correlation coefficients between the
MUA sequences in each experiment are shown, calculated over two
trials. (a) For both 0o and 40o orientation
jitter, the high-frequency network was significantly more synchronized
than the low-frequency network (p < 0.003). The difference is more
pronounced in the 40o case, as predicted by the lateral
connection distributions in Figure 13.21. (b) At 0o
orientation jitter, the performance of broad and narrow curvature
range networks is comparable (p > 0.7), but with 40o of
jitter the broad curvature network performs significantly better (p
< 0.0009), as predicted by the connection distributions in Figure
13.22.
|

