Click on the image to see a PDF version (for zooming in)
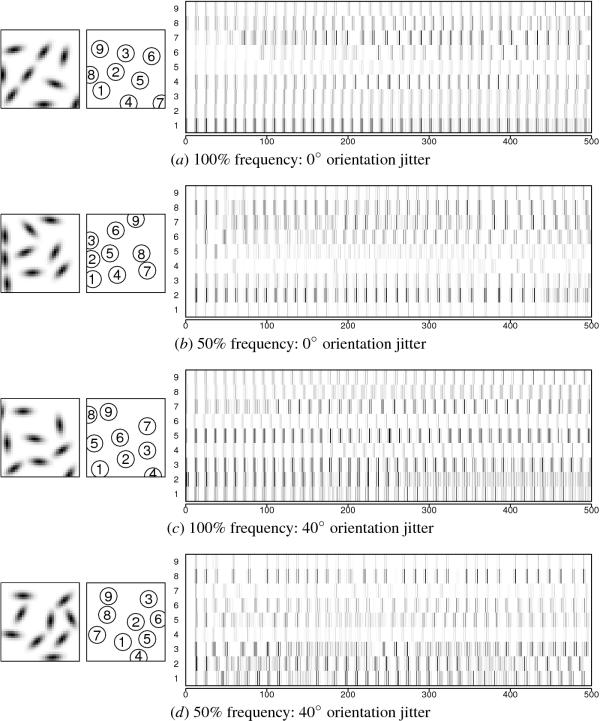
Fig. 13.23. Contour integration process with different input
frequencies. In each MUA plot, the three bottom rows correspond to
the MUA sequences for the three contour elements in the input and the
rest correspond to background elements. For the same degree of
orientation jitter (0o or 40o), the more
frequently trained network is more strongly synchronized (a vs. b; c
vs. d).
|

