Click on the image to see a PDF version (for zooming in)
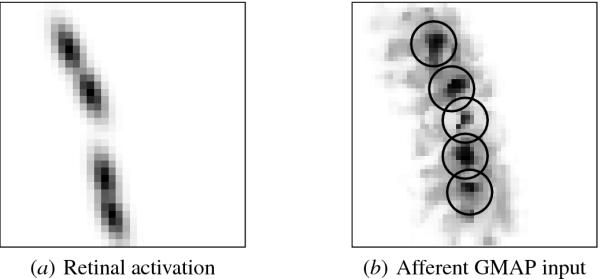
Fig. 13.13. Afferent contribution in contour completion. The
afferent contribution of the input in (a) to the GMAP activation is
plotted in gray scale from white to black (low to high) in (b); the
circles delineate the MUA areas as shown in Figure 13.12. The four
areas corresponding to the four contour elements all receive strong
afferent input. The center area, corresponding to the gap, receives
weak afferent input, due to slight overlap with neighboring regions in
the retina. However, as seen in Figures 13.14 and 13.15, it is not
enough to activate its representation without a contribution from the
lateral connections.
|

