Click on the image to see a PDF version (for zooming in)
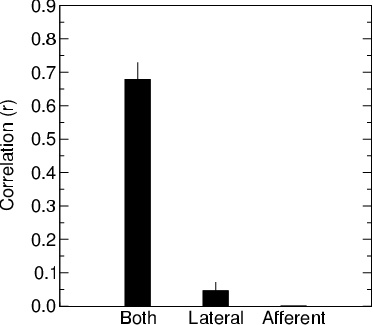
Fig. 13.15. Contour completion performance with different kinds of
connections. The average correlation coefficients for the four MUA
sequences representing the four input contour elements vs. the MUA
sequence representing the gap are shown, calculated over two
trials. Both afferent and excitatory connections are included in
"Both". In "Lateral", the afferent connections are removed from the
center, i.e. binding is due to excitatory lateral connections only. In
"Afferent", the excitatory lateral connections are removed from the
center, and binding is based on afferent connections only. The plot
shows that both afferent and excitatory contributions are necessary
for contour completion (p < 10-7).
|

