Click on the image to see a PDF version (for zooming in)
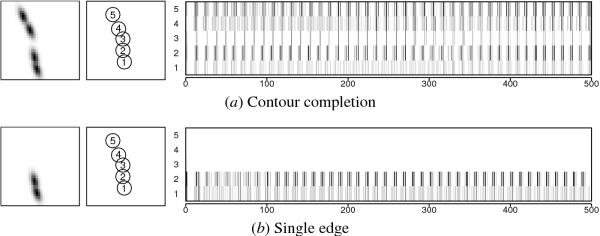
Fig. 13.12. Contour completion process. (a) The four contour
elements in the input with a gap in the middle correspond to one side
in the edge-detected Kanizsa triangle (the dashed oval in Figure
13.4). In the MUA plot, the four contour elements are shown in the
bottom and the top (rows 1-2 and 4-5) and the gap in the middle (row
3). Even though there were no inputs in the middle, the cortical area
representing the gap is activated, and the activations are
synchronized with the other four MUA sequences. This behavior
indicates that contour completion occurred and the gap is perceived as
an illusory edge. (b) In the second experiment, the input consisted of
two contour elements from only one side of the gap. The MUA sequence
for the gap is silent (row 3), indicating that contour completion did
not occur. Thus, both sides of the gap need to be stimulated for the
gap to be perceived as an edge.
|

