Click on the image to see a PDF version (for zooming in)
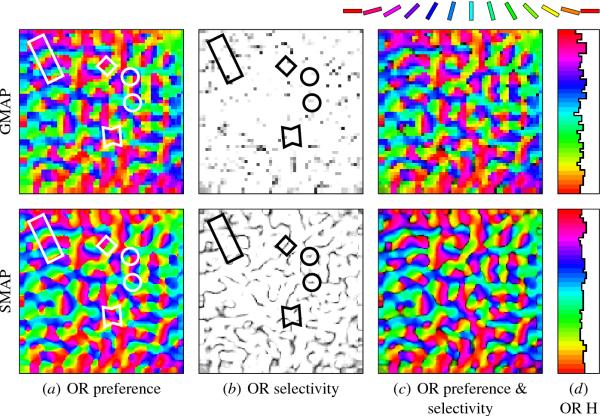
Fig. 11.4. Self-organized orientation map. The orientation
preference and selectivity of each neuron in SMAP and GMAP are plotted
using the same conventions as in Figure 5.9. Because of the
intracolumnar connections, the two maps develop similar
organizations. As in LISSOM and in biological maps (Figures 2.5 and
5.9), the preferences change smoothly across the cortex, and exhibit
features such as linear zones, pairs of pinwheels, saddle points, and
fractures (outlined as in Figure 2.4). As in animal maps, the neurons
at the pinwheel centers and fractures are unselective for orientation
(these features are more prominent in the SMAP, which drives the
self-organization). The orientation histograms are essentially flat
and therefore free of artifacts. These plots show that realistic
orientation maps can be formed with spiking neurons and with the SG
model of cortical columns.
|

