Click on the image to see a PDF version (for zooming in)
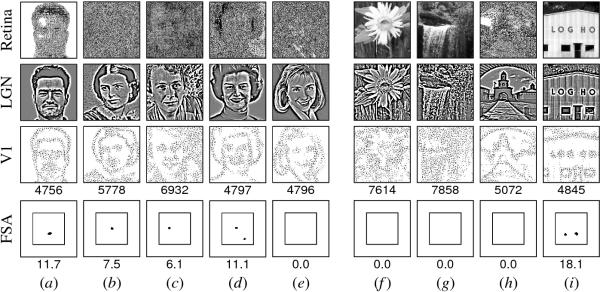
Fig. 10.9. Response to natural images. The top row shows a
sample set of photographic images. The corresponding LGN, V1, and FSA
responses are displayed as in Figures 10.6 and 10.7. The FSA is indeed
activated at the correct location for most faces of the correct size
and orientation (e.g. a-d), including 88% of those in the Achermann
(1995) database. Just as importantly, the network is not activated for
most natural scenes and man-made objects (f-h). In fact, the FSA
responded to only 4.3% of 348 presentations of landscapes and other
natural scenes from the National Park Service (1995). The spurious
activations usually result from a V1 activation similar to that of a
three-dot arrangement of contours (d and i), including related
patterns such as dog and monkey faces (not shown). Response is low to
images where hair or glasses obscure the borders of the eyes, nose, or
mouth, and to front-lit downward-looking faces, which have low V1
activation from nose and mouth contours (e). The model predicts that
newborns respond in the same way if tested. Credits: (a) copyright
1995 by University of Bern (Achermann 1995), (b-e) public domain; (f-i)
copyright 1999-2001 by James A. Bednar. Reprinted from Bednar and
Miikkulainen (2003a).
|

