Click on the image to see a PDF version (for zooming in)
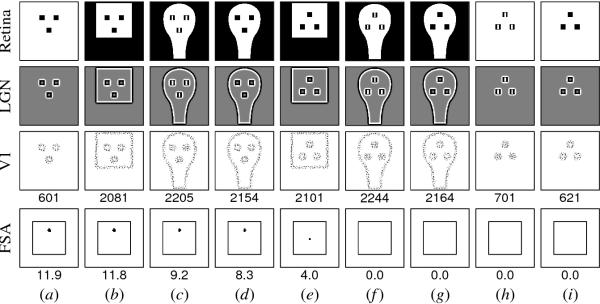
Fig. 10.7. Response to schematic images by Valenza et al. (1996)
and Simion et al. (1998a). Valenza et al. measured preference
between static, projected versions of pairs of the schematic images in
the top row, using newborns ranging from 24 to 155 hours after
birth. They found the following preferences: d > f , d > g, f
> g, and h > i. Simion et al. similarly found a preference for d
> g and b > e. The LGN, V1, and FSA responses of the model to
these images are displayed here as in Figure 10.6, and are again
sorted by the model's preference. In all cases where the newborn
preferred one pattern over another, so did the model. For instance,
the model FSA responds to the facelike pattern (d) but not to the
inverted version (g). Patterns that closely match the newborn's
preferred spatial frequency (f and h) caused a greater V1 response
than their low-frequency versions (g and i). Some non-facelike
patterns with high-contrast borders can cause spurious FSA activation
(e), because part of the border completes a three-dot pattern. Such
spurious responses did not affect the predicted preferences, because
they are smaller than the genuine responses (see Figure 10.8 for more
details on how spurious responses typically arise). Interestingly,
Simion et al. found no preference between (a) and (i) in 1-6-day-old
infants. The model predicts that (a) would be preferred at birth, due
to the FSA response, but not by older infants who have learned face
outlines postnatally. Reprinted from Bednar and Miikkulainen (2003a).
|

